Content Analytics System
Making self-service measurable.
Help center decisions relied on intuition because traffic and support data lived in separate tools. I built a reporting system that combined GA4 usage signals with Zendesk ticket data, giving three teams a shared way to measure self-service and prioritize improvements.
0
ENGINEERING
ROLE
Content Strategist & Analytics Lead
TIMELINE
2025, 3-months
TEAM
Enablement, CX, Support
TOOLS
GA4, Zendesk Explore, Google Sheets
01
THE CHALLENGE
We could see traffic. We couldn't tell whether self-service worked.
Help center reporting was limited to basic activity metrics. We knew how many views articles received, but we lacked a reliable way to connect that activity to whether users found answers or contacted Support.
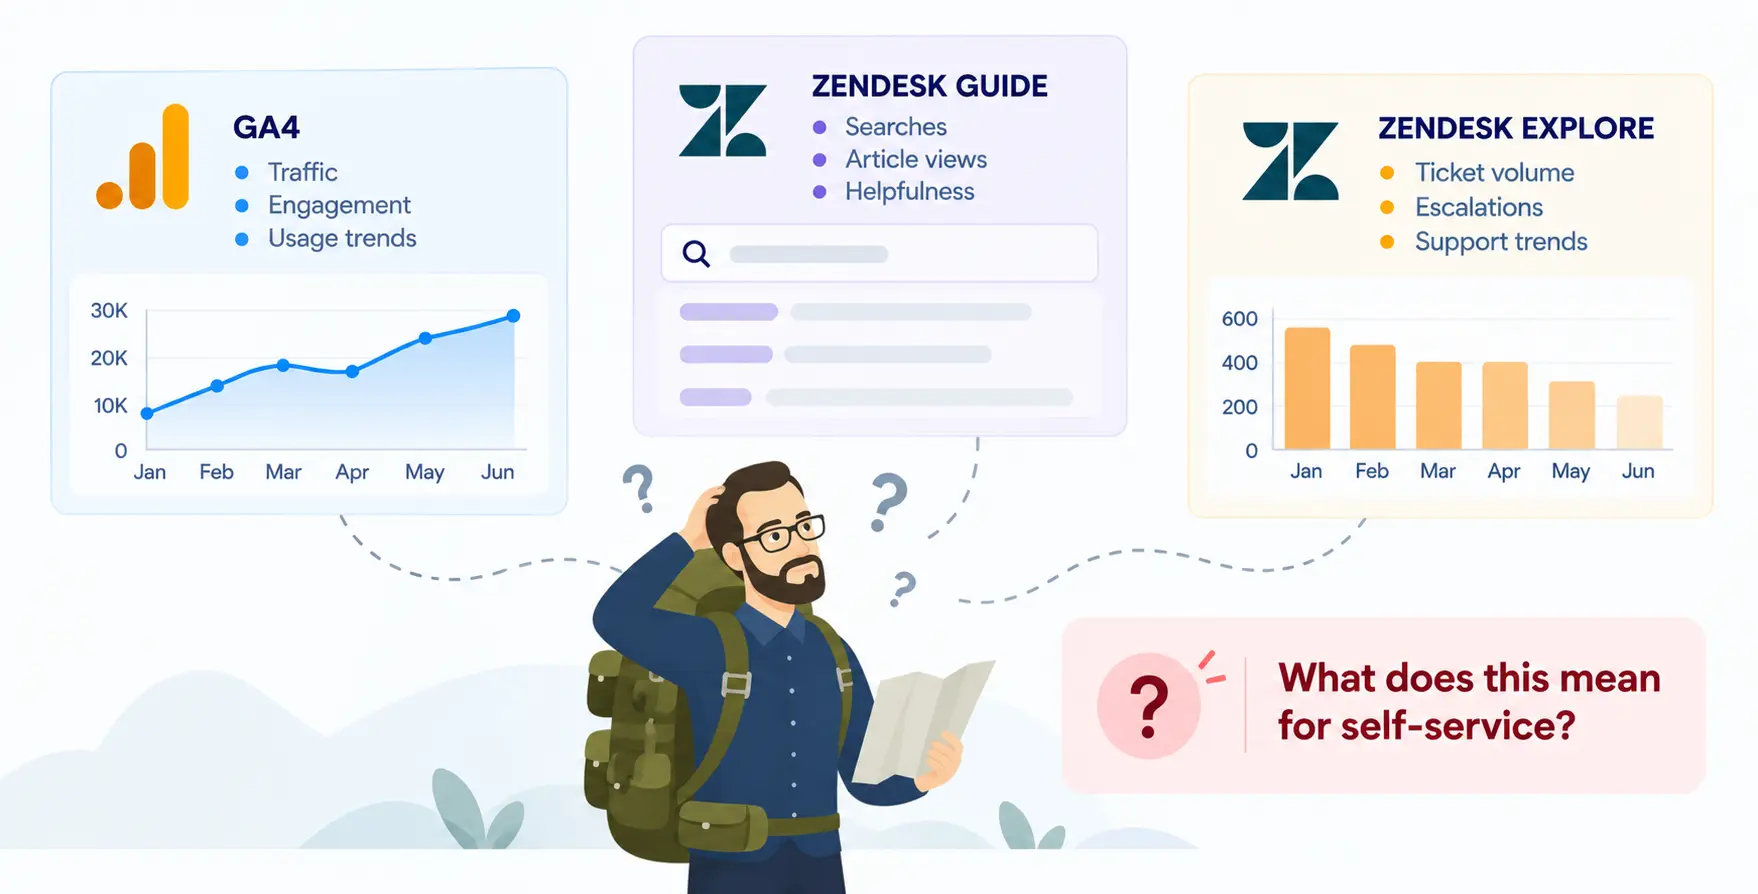
GA4, Zendesk Guide, and Zendesk Explore each held part of the picture. None provided a shared view of self-service effectiveness.
That left content decisions dependent on intuition. A popular article could be helpful—or it could attract users who still needed to submit a ticket. A drop in traffic could indicate reduced demand, a discoverability problem, or a change in how internal teams accessed documentation.
Without connecting the signals, we couldn't confidently distinguish between those possibilities.
02
THE INSIGHT
Traffic isn't the same as success.
My initial review showed that the default dashboards answered questions about activity, not effectiveness.
Pageviews told us people arrived. Search volume told us people were looking. Neither told us whether they found what they needed.
I shifted the measurement question from “How much is our content being used?” to “Is our content helping users resolve problems without contacting Support?” That required combining usage signals with ticket escalation data and examining them over time. I also needed to separate internal staff activity from customer behaviour. Otherwise, heavy internal usage or QA activity could make self-service appear healthier than it actually was.
The key decision was to create a shared measurement framework rather than add another dashboard of disconnected metrics.
“Traffic tells you people showed up. It doesn't tell you whether they left with an answer.”
03
THE SYSTEM
One measurement framework connecting usage to support demand.
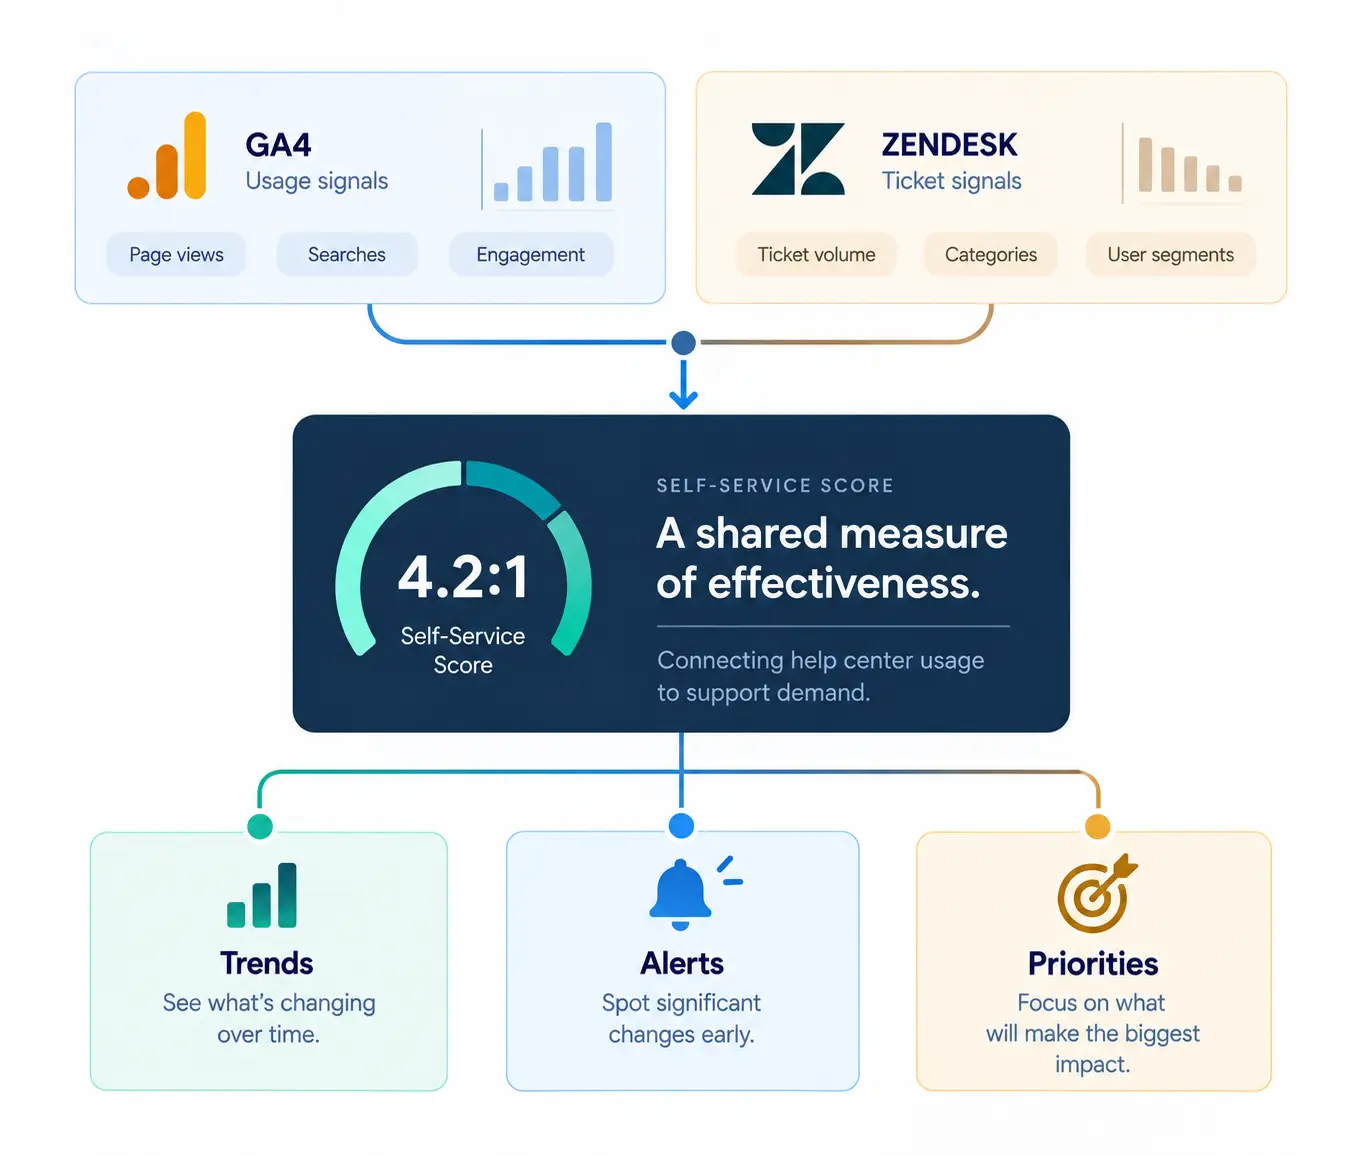
I built a self-service reporting system using GA4, Zendesk Explore, and Google Sheets.
At its centre was a Self-Service Score that brought help center usage and ticket escalation signals into one consistent measure. Rather than treating any individual metric as proof of success, the framework made it possible to monitor how those signals moved together.
I paired the score with segmented reporting, monthly and quarterly trend tracking, and automated alerts so teams could identify changes and investigate their causes.

04
KEY DECISIONS
Build a system people could trust and maintain.
01
Connect activity to support demand.
I rejected pageviews and search volume as standalone success measures. They show demand for content, but not whether that demand is being resolved. I combined usage and ticket escalation signals into a shared score, giving teams a more meaningful way to monitor self-service. The score was a decision signal, not proof that a specific article prevented a ticket.
02
Segment before drawing conclusions.
Internal staff and QA activity could inflate traffic and distort customer trends. I separated internal and end-user activity so reports could reflect different audiences rather than treating every visit as equivalent. A metric is only useful when you know whose behaviour it represents.
03
Prioritize trends over isolated numbers.
A single month's score can fluctuate for reasons unrelated to content quality. Monthly and quarterly tracking made changes easier to investigate in context. Alerts drew attention to unusual movement without replacing human analysis. The goal was to identify where to investigate, not automate conclusions.
04
Design around the tools we already had.
Engineering support wasn't available, so I built the framework using GA4, Zendesk Explore, and Google Sheets. That constraint shaped the solution: a transparent, maintainable reporting system that the teams could operate without a custom analytics application. A useful measurement system doesn't require a new platform.
05
THE TRANSFORMATION
From reporting numbers to investigating problems.
Previously, reporting focused on available metrics: views, searches, and ticket totals. Teams had to interpret those numbers separately, often without a consistent baseline or shared definition of success.
The new system created a repeatable workflow. Teams could monitor the Self-Service Score, identify changes in the trend, inspect the underlying usage and ticket signals, and decide which content or experience problems warranted attention.
It changed analytics from an occasional reporting task into an ongoing input to content strategy.
BEFORE
Report activity limited to:
Collect pageviews
Review searches
Count tickets
Interpret separately
AFTER
Now we can investigate and improve:
Monitor score
Detect change
Investigate signals
Prioritize improvement
06
the outcome
A shared evidence base for three teams.
Within three months of the reporting framework going live, self-service traffic increased by 60%.
The framework also gave Enablement, Customer Experience, and Support a shared evidence base for discussing help center performance and identifying opportunities for improvement.
Instead of requesting isolated metrics or relying on intuition, stakeholders could draw from an established reporting system.
"Honestly, I'm just happy we have this. I pull numbers straight from it now whenever leadership wants specifics."
— Senior Director, Enablement & Education
07
What I Actually Designed
The measurement system behind the dashboard.
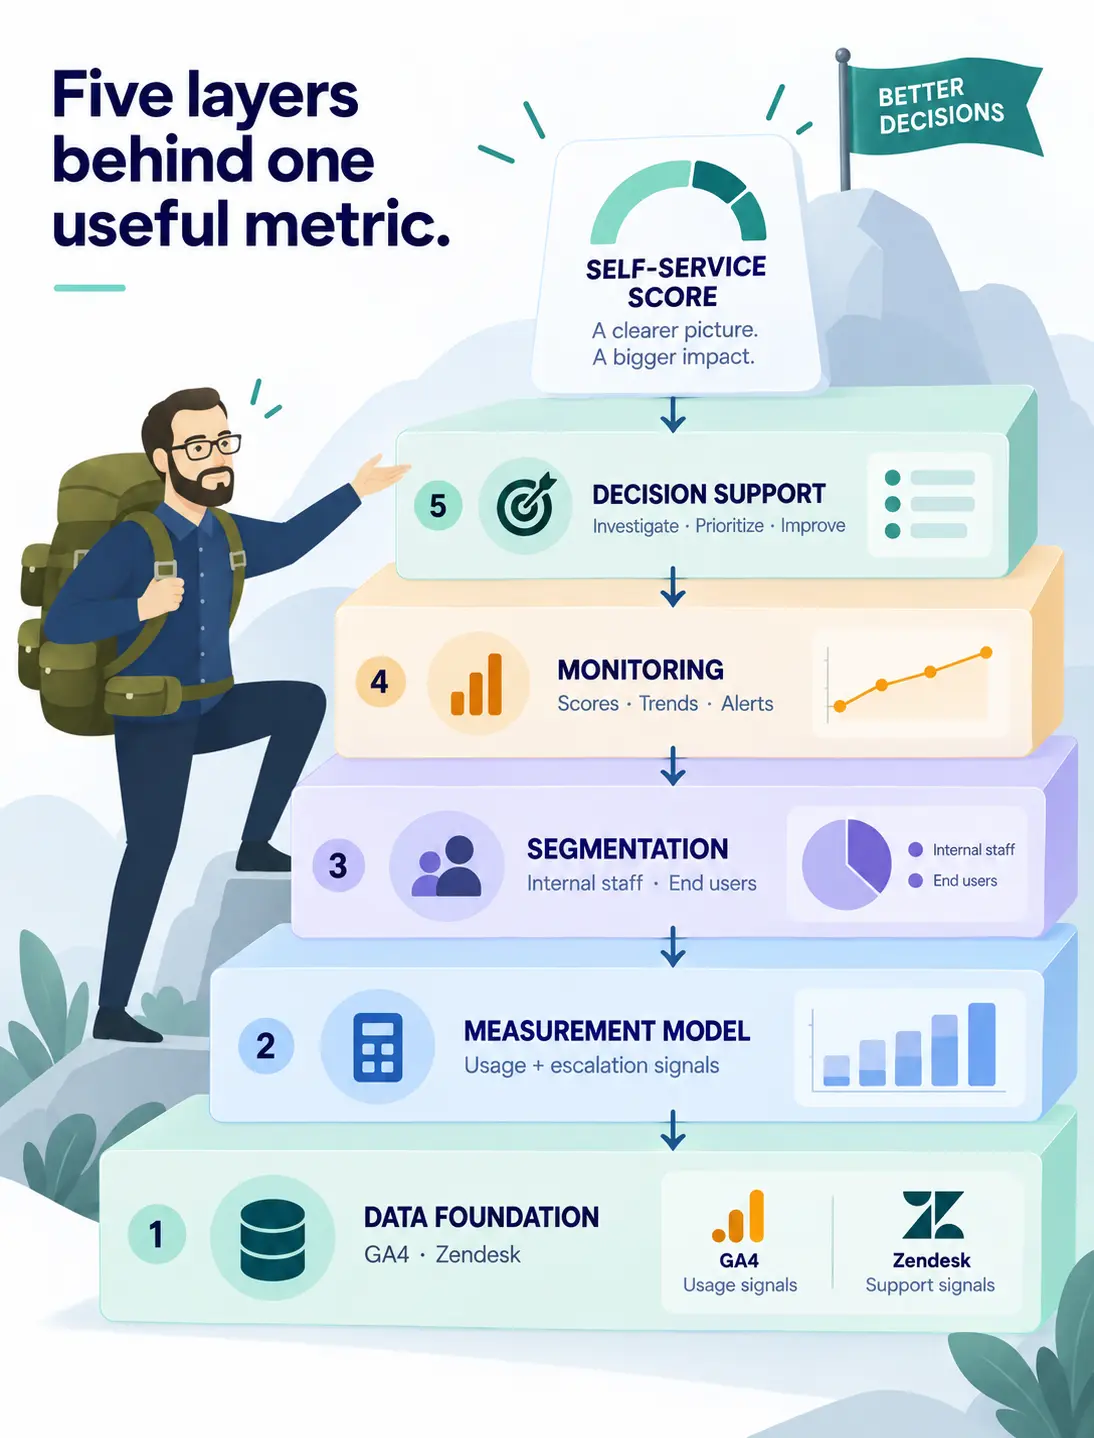
The visible output was a reporting dashboard. The underlying work was designing how the organization measured self-service.
I defined the metrics and connected usage data with support signals. I established audience segmentation to keep comparisons meaningful, then built the score, reporting cadence, and alerts that made performance easier to monitor.
I also designed the reporting around how teams would use it: a shared view for leadership, enough detail for operational investigation, and a repeatable process for identifying content priorities.
The value wasn't another dashboard. It was a system that turned fragmented data into a shared basis for decisions.
08
THE BIGGER IDEA
Measurement should change what happens next.
Analytics only becomes useful when it helps people make decisions.
The reporting framework connected content usage and support demand, then made the relationship visible through a shared score, trends, and alerts.
It gave teams a consistent starting point for asking better questions: Where is self-service improving? Where is it struggling? What should we investigate next?
The goal wasn't to report more numbers. It was to make the numbers useful.
09
Reflection
A useful metric needs context, not just a formula.
The hardest part wasn't connecting GA4 and Zendesk. It was deciding what the combined data could meaningfully tell us—and what it couldn't.
Traffic alone couldn't establish success. Ticket volume alone couldn't establish failure. Internal usage could distort customer trends, and changes over time could reflect factors beyond documentation quality. That shaped the system: segment audiences, define metrics consistently, track trends, and use alerts to trigger investigation rather than automatic conclusions.
The biggest lesson was that measurement design is part of content strategy. If teams don't share a definition of success, more dashboards won't create alignment.
As the system matures, I'd focus on validating the score against more direct evidence of successful self-service and improving the connection between identified problems and subsequent content changes.
Want to know how the Self-Service Score is actually weighted, or what almost got measured instead? Reach out and I can go into the details!